
I built an interactive map of alcohol-sale licenses in Krakow. It is available at dobra-noc-krakow.pl/alkomapa.
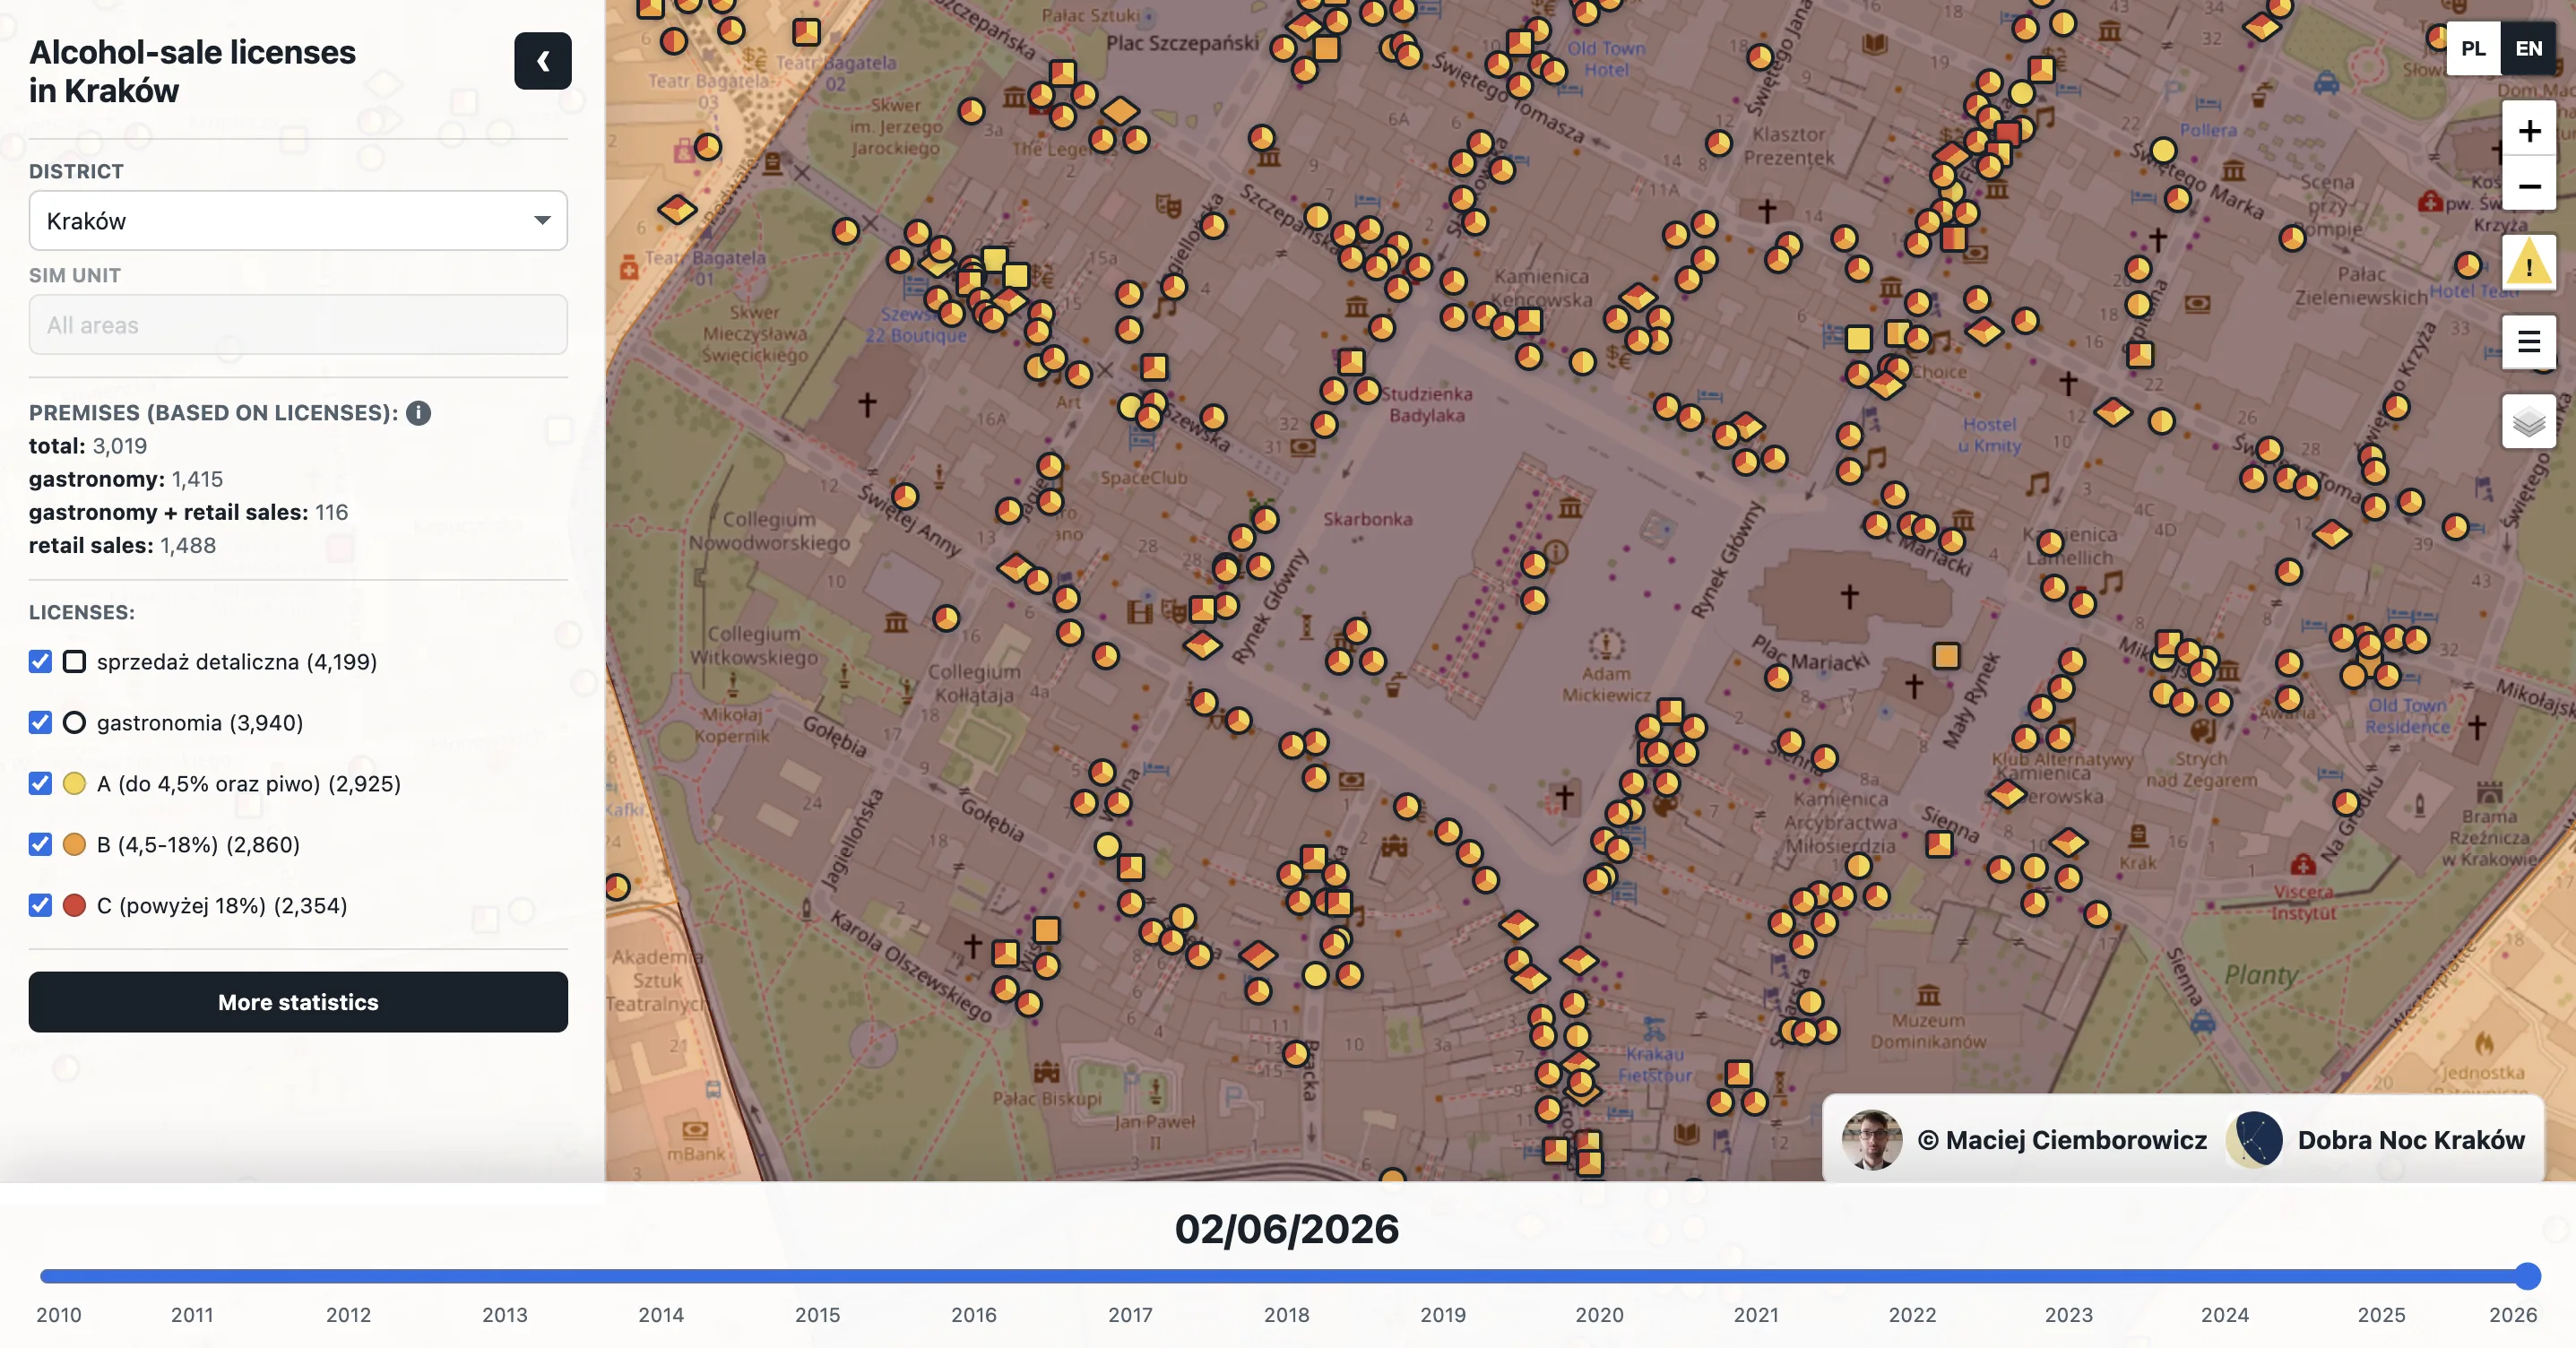
The city publishes alcohol-license lists as administrative records. That makes them useful, but not immediately easy to read on a map. The work behind this project was mostly the unglamorous part: collecting reports, importing tables, normalizing addresses with regular expressions, checking geocoding results, and deciding how separate licenses should be represented when they refer to one place.
The distinction matters. A shop, bar, or restaurant can appear several times in the source data, because different alcohol categories and different forms of sale are separate administrative records. The map therefore does not simply drop every row from a table onto OpenStreetMap. It groups related licenses into analytical sales points, while still keeping the underlying records available for inspection.
I also added a time slider and basic statistics, because a static map answers only one question: where things are now. The more interesting use case is comparing how the distribution changes across reports, districts, and SIM units. The interface lets you filter retail sales and gastronomy separately, switch license categories on and off, and inspect local density without leaving the map.
I also published the dataset on Zenodo: zenodo.org/records/21895077. The related article has been submitted to Scientific Data. I hope to receive a full waiver for the article processing charge; without it, publication will not be possible.